Inventory Dashboard
The Inventory Dashboard gives you a real-time overview of how your screen network’s airtime is being used. It surfaces saturation levels and overbooking warnings so you can spot scheduling problems before they affect playback.
To open the dashboard, go to Statistics > Inventory Dashboard.
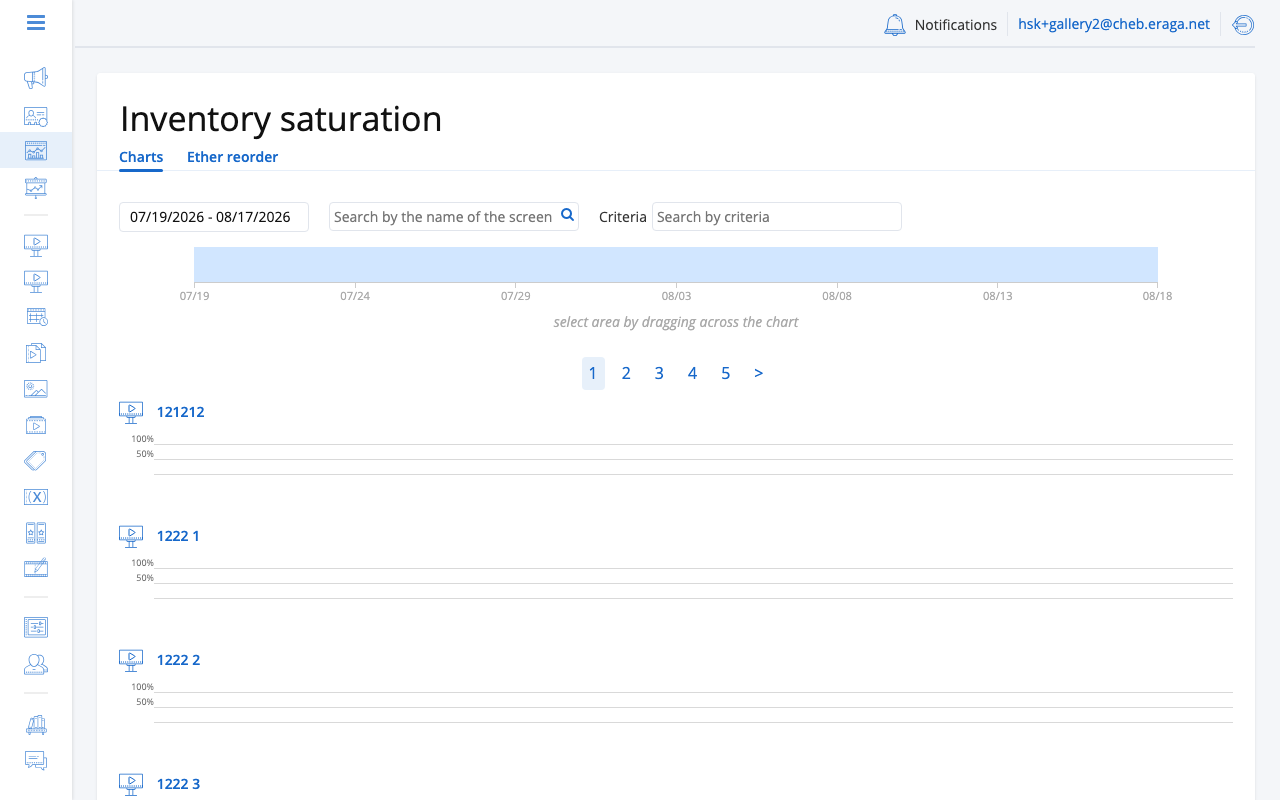
Saturation
Saturation is the share of a frame’s available airtime that scheduled content occupies, expressed as a percentage. There is one chart per frame, and one bar per period — a stretch of time over which the booking does not change. Periods are not all the same length, and a bar’s width is its duration, so a wide bar is a long quiet stretch rather than a big number.
100% means the frame’s capacity for that period is exactly used up: every second the planner had to sell has been sold.
Above 100%
Saturation can exceed 100%, and this is the single most useful thing the chart tells you. More content has been booked into the period than the frame can physically broadcast, so something will be dropped at playback time. The Overbooking section below covers what to do about it.
The chart never hides this and never quietly rounds it away:
-
The part above 100% is drawn as a separate cross-hatched segment sitting above the 100% gridline, so it survives greyscale and printing. The legend calls it Oversold.
-
The number in the table beside the bar is always the true figure, whatever the bar does.
The two places saturation is charted handle the top of the axis differently, on purpose:
- Screen Saturation tab
-
The axis is fixed, running 0–150% with gridlines at 0, 50, 100 and 150. A period above 150% is drawn at the ceiling with a torn top edge and tagged "Cut off at 150% — the figure beside it is the real one". Reach for the table when you see the torn edge.
- Inventory Dashboard
-
The axis stretches to the highest value anywhere on the page, rounded up to a multiple of 25 and never below 100, and every chart on the page shares it. Nothing is clamped, and bars from different screens are comparable by eye — which is the point of a fleet view.
What the colours mean
Colour does not encode how full a period is; height already does that. Colour says which kind of playlist governs the period, because that determines what you can do about the number:
-
Auto / Algorithmic — filled by the planner. These are the periods with a campaign roster you can open; see Which Campaigns Fill a Period.
-
Manual — governed by a fixed playlist the operator built. See Manual Periods.
-
Black screen — no content is scheduled at all.
-
No playlist — no playlist governs the period.
-
No inventory (dashboard only) — there was nothing to sell here. This is not the same as 0%: 0% means there was airtime and none of it sold, while "no inventory" means there was no airtime to begin with. A bar of height zero would say both, so this state gets its own colour.
A per-frame table under each chart repeats every period as text: start, playlist kind, sold percentage, booked and available minutes, and the campaign count. Where a figure was not supplied it is shown as absent rather than as zero.
Overbooking
When the total scheduled ad time exceeds the available airtime for a frame, the dashboard flags it as overbooked. Overbooking typically happens when multiple campaigns target the same screens during the same time window.
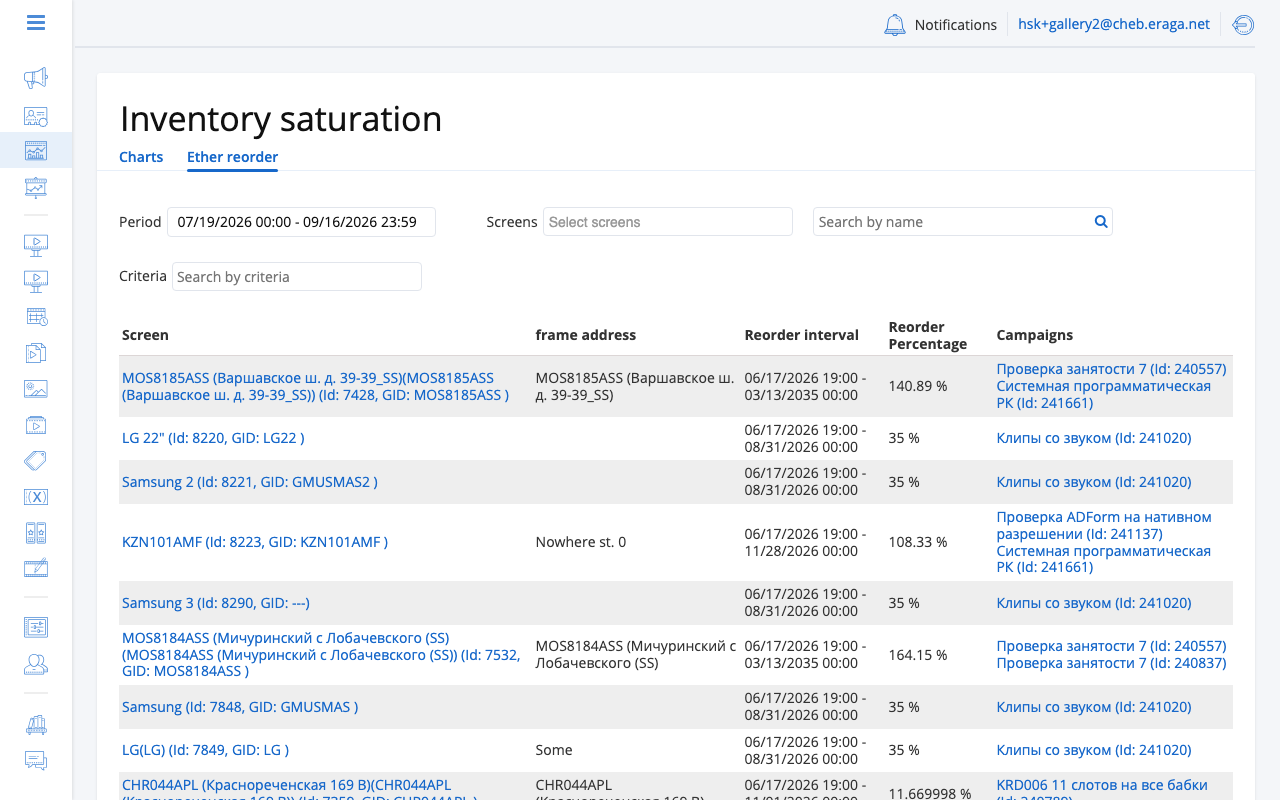
The overbooking table shows affected frames with configurable columns. You can adjust which columns are visible to focus on the metrics that matter to you. Column preferences are saved automatically.
| Overbooked frames will not play all scheduled ads. Review and adjust campaign schedules or screen assignments to resolve overbooking. |
Choosing the period
There are two period controls, they look similar, and they do quite different things. Confusing them is the usual reason a chart "will not update".
From / To — the fetch window. This is the question put to the platform, and the only one of the two that fetches data.
-
Changing it fetches again. The charts blank while the request runs.
-
On a screen’s Saturation tab it cannot span more than 62 days. A longer range, or a range whose dates are the wrong way round, is refused with a message.
-
A link to the page carries the period with it, so a colleague who opens it sees the same window.
-
Left alone, it starts today and runs forward. How far forward is your own preference, set with the other list and filter preferences in your user settings; it defaults to 30 days and is held between 1 and 62. Saturation is about air that is booked, so the default window looks ahead rather than back.
The range overview band — the visible zoom. A single strip under the fetch controls, covering the whole fetched window. Drag across it, or type dates into Look from and Look to, and the charts below redraw to that slice.
-
Nothing is fetched. The data is already in the browser and the zoom only decides how much of it is drawn. That is why zooming is instant and changing From / To is not.
-
The band always draws the whole fetched window, never the zoom. It is the index, not the page — shading a selection on a band that had itself been zoomed would leave you with nothing to aim at and no way back.
-
The zoom is not in the address. It is a way of looking, not a query, so a shared link reopens on the whole fetched window.
-
Show the whole range clears it, and so does any fetch: change the period and the zoom resets.
-
The band appears only when there is more than one period to show. On a narrow window the drag is switched off and the two date fields become the only way to zoom, which is why they are always there.
If a chart is not showing what you expect, ask which of the two is responsible. A period missing altogether was never fetched — widen From / To. A period that is in the data but not on the chart means the zoom is narrower than you thought — click Show the whole range.
Filtering
On the Inventory Dashboard, two further controls narrow which screens are charted rather than which time is:
-
Screens — pick individual screens by name, with search.
-
Criteria — pick screens by the criteria attached to them, to chart a whole group at once (all mall screens, all outdoor screens).
Both are held in the page address alongside the period and are applied when you press Search, so a shared link reproduces the whole view. Reset clears them.
Reading the Dashboard
| Check the dashboard regularly, especially after publishing new campaigns. Catching overbooking early prevents ad delivery issues. |
-
A screen that stays well under 100% may indicate unused inventory that can be monetized through Filler Campaigns or Programmatic (RTB) sales.
-
An overbooked screen requires attention — either remove conflicting campaigns, shorten ad durations, or redistribute content across more frames.
-
Use the time range selector to check future scheduling and anticipate problems before they occur.