Interactive ads debug mode
To develop and test an interactive advertisement without a CS Play account, run the player in the debug mode: it imitates the playback of a single interactive ad from a local folder.
On Windows launch cityscreen-player.exe (not CSPlayer.exe!), located by default in
C:\Program Files\CSPlayer\lib\player, with the following command-line arguments.
Launch arguments
1. --dev-package C:\Path\To\Folder
Required argument that enables the debug mode. The value is the path to the folder containing the
interactive ad. The folder root must contain an index.html file. If the path is wrong or the file
is missing, the application starts showing only a black screen; the corresponding error is written
to the logs. Example:
--dev-package "C:\Users\user\AppData\Local\CityScreen\CSPlayer\screen\files\example"
2. --inject-json C:\Path\To\playerData.json
The value is the path to a file with the JSON object that should be passed to the interactive ad
during testing; it initializes the csBackend.playerData object on the ad side. Optional. When
omitted, an empty JSON object is passed. Example:
--inject-json "C:\Users\user\AppData\Local\CityScreen\CSPlayer\screen\files\example\inject.json"
3. --slot-duration int|msec
Playback duration of the interactive ad — the equivalent of the advertisement duration, in milliseconds. Optional. When omitted, the ad plays until the application is closed. Example:
--slot-duration 10000
4. --preload-duration int|msec
Preload duration before the playback starts, in milliseconds. Optional. When omitted, the preload duration is set to 3000 ms. The minimum value is 3000 ms. Example:
--preload-duration 10000
How the debug mode works
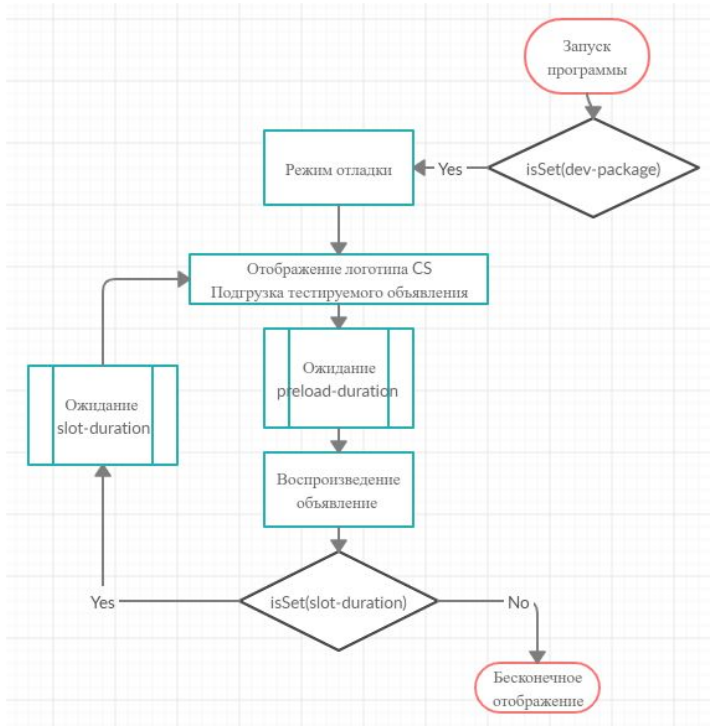
When the application is started in the debug mode (with the required --dev-package argument),
the player imitates the playback of a single interactive advertisement.
Debugging via a Chromium browser
Once the advertisement is loaded, you can attach the remote Chromium developer tools to the
application. With the player running in the debug mode, open
http://localhost:<port>; in Chrome (or another Chromium-based browser). The port is set by the
--debug-remote-port argument; by default the panel is available at http://localhost:11111.
|
Starting with Google Chrome version 80, remote debugging requires launching the browser with the following arguments:
A corresponding notice will be shown in the Chrome window: 
|
A matching Chromium build can be downloaded here.
Web content caching
CS Player caches the resources downloaded for websites and HTML5 advertisements (pages, scripts, styles, images) on disk, just like a regular browser. This speeds up repeated loads, but the player may keep showing an outdated version of a site after it has been changed.
Disabling caching on the web server (for development)
While developing and debugging a site, it is recommended to disable caching on the web server side — this guarantees the player always loads the current version of the content.
To do so, add the Cache-Control: no-cache, no-store, must-revalidate HTTP header to the
server responses.
Example nginx configuration:
location / {
    try_files $uri $uri/ =404;
    expires -1;
}
The expires -1 directive makes nginx send headers that forbid caching.
| After the development and testing are finished, revert the caching settings to production values: disabled caching increases the server load and traffic volume. |
Clearing the web content cache on the player
If the player keeps showing outdated content (for example, after a site update with caching enabled), clear the cache manually:
-
Stop CS Player.
-
Open the following directory in Windows Explorer:
%LOCALAPPDATA%\CityScreen\cityscreen-libqt5player\QtWebEngineThe full path looks like
C:\Users\<user>\AppData\Local\CityScreen\cityscreen-libqt5player\QtWebEngine. -
Delete the contents of the
QtWebEnginefolder (or the folder itself). -
Start CS Player — the cache folder is recreated automatically.
To open the hidden AppData folder, type %LOCALAPPDATA% in the Windows Explorer
address bar and press Enter.
|